Listing Processes in Linux

Jump To...
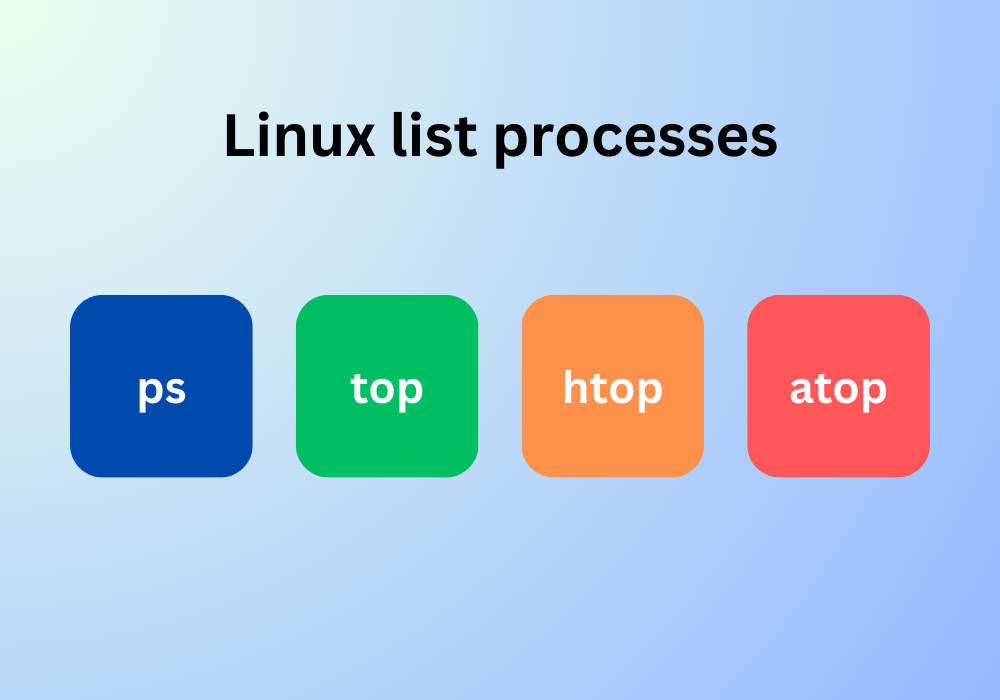
Way to Check Running Processes in Linux Using ps, top, htop, and atop Commands
Monitoring active processes in Linux is crucial for efficient resource management, especially on smaller systems where CPU time and I/O bandwidth are precious commodities. Utilizing commands such as ps, top, htop, and atop provides valuable insights into your Linux server, enabling effective management of processes that may be consuming excessive resources and adversely affecting performance.
Linux Processes Basic Overview
A process in a computer system refers to the active execution of a program. When a user initiates an application or inputs commands into the terminal, the operating system creates a process. Concurrently, multiple processes can run, contributing to the system’s overall functionality.
In Linux systems, processes play vital roles, forming integral components of the system’s operations. Each process running in Linux is assigned a unique Process Identification Number (PID) by the operating system, facilitating efficient tracking and management. To carry out various tasks, such as listing current processes, terminating specific ones, or monitoring real-time CPU and memory utilization percentages associated with them, it is essential to gather information about the currently active processes on Linux-based systems.
Checking Active Processes in Linux
Linux provides various methods for effectively monitoring running processes, with commonly used techniques including ps, top, htop, and atop. Each of these commands serves a specific purpose and offers unique functionalities within the realm of process management.
The ps command is utilized to check the currently running processes. Meanwhile, the top command provides a real-time snapshot of the active processes, offering a comprehensive view of system resource usage. For those seeking an interactive interface, the htop command proves valuable, allowing users to navigate and manage processes more intuitively. Lastly, the atop command aids in analyzing system performance, providing insights into resource utilization and process behavior.
Guide on Checking Linux Processes with the "ps" Command
The ps command provides a static snapshot of currently running processes
To use the ps command, open a terminal and type “ps” to list running processes in a specified format:
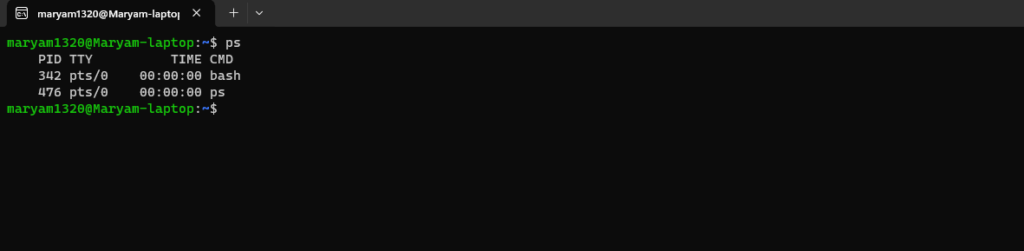
The ps command provides a comprehensive list of all running processes on your system. Unlike the Windows Task Manager, the results are definitive. The output includes essential details such as the PID (process ID) for unique identification, TTY indicating the controlling terminal, TIME representing the running time of the process, and CMD revealing the name of the command that initiated the process.
You can enhance the level of detail provided by the ps command in Linux by using additional arguments in the command line. Some of these include:
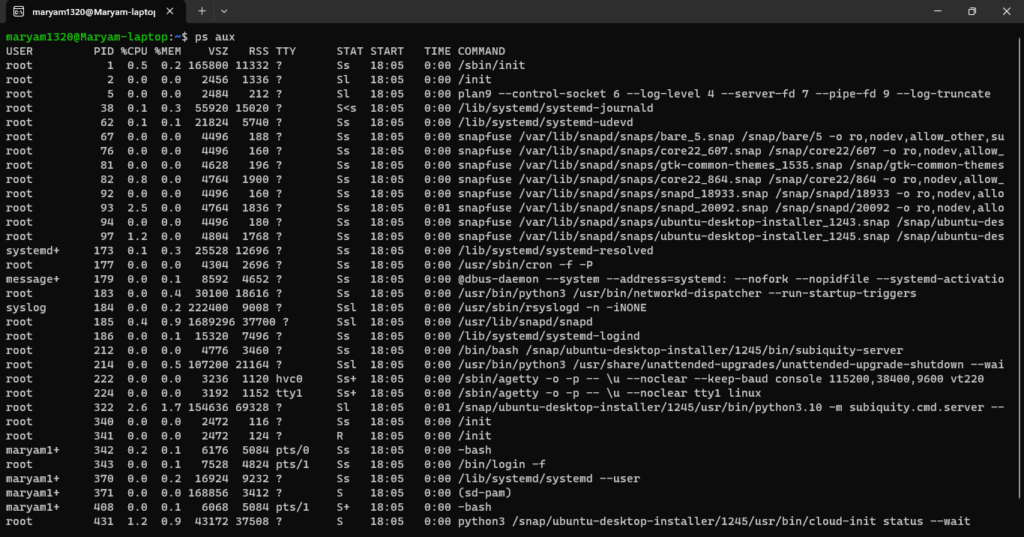
ps aux
The ps aux command in Linux provides a more detailed output than the default ps command, presenting 11 columns for in-depth information about running processes:
a: provides a list of all processes for all users on the system.
u: provides the option to display the user’s name instead of the ID.
x: displays processes, including those executed in the terminal.
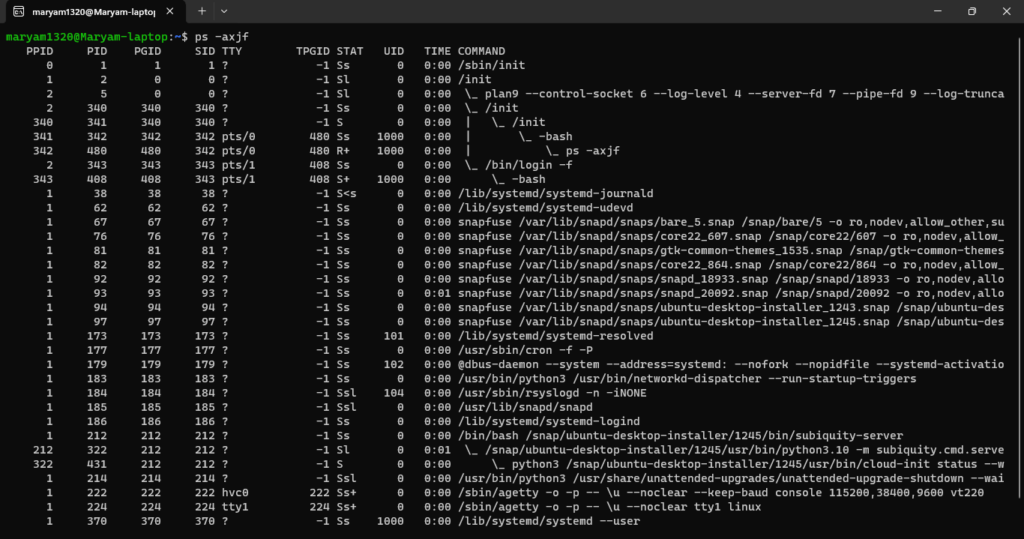
ps -axjf
The ps -axjf command provides results akin to the ps au command but with additional details for each process. This includes information such as the Process Group ID (PGID), Session ID (SID), initiation time, and command arguments. The hierarchical arrangement of child processes under their respective parent process names helps depict the process structure more clearly.
To further analyze the above ps command options and output:
a: lists all processes, irrespective of their association with a terminal.
x: reveals processes that are not executed from a terminal.
j: displays the process group ID instead of information specific to terminals.
f: displays the entire command line, including arguments, for each process.
Guide on Monitoring Linux Processes with the "top" Command
The top command enables real-time monitoring of active processes, presenting them in descending order based on CPU utilization. This layout quickly identifies resource-intensive tasks by placing processes with the highest CPU usage at the top.
To utilize the top command, open your terminal and type top. Press Enter to display comprehensive performance metrics and view the corresponding output.
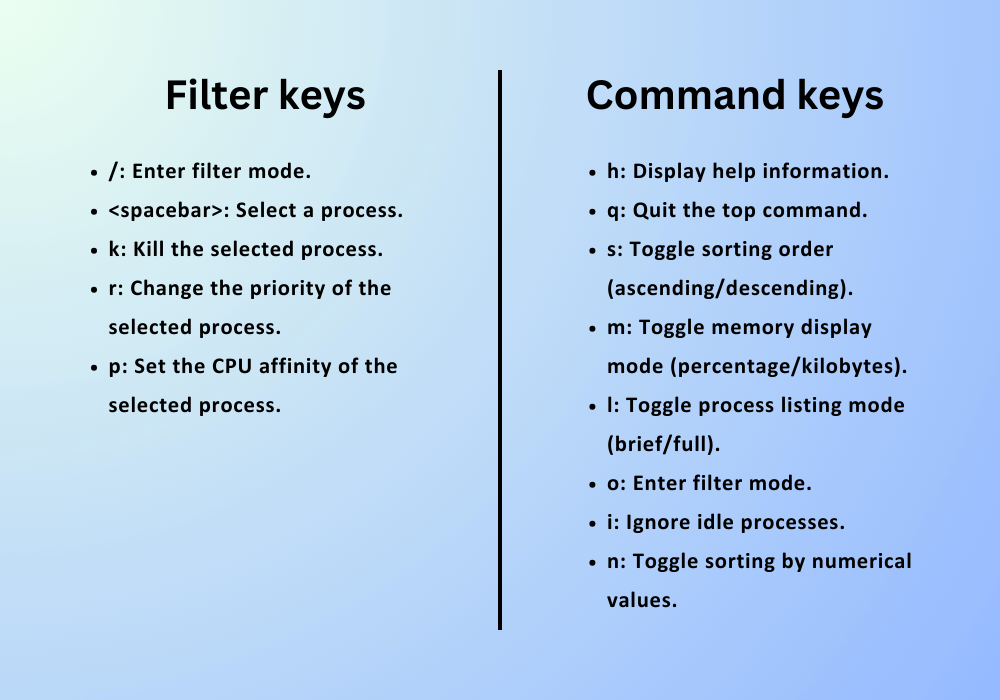
The top command delivers real-time updates on active processes, revealing counts for various process states to assist users in identifying resource-intensive tasks. Its functionality extends beyond basic monitoring, offering additional features through command keys like Filter, Sorting, Command, and Navigation. Users can further customize their experience using examples of filtering and command keys.
k: kills a process
h: displays help information
q: quits the top mode
s: changes the sorting order
m: changes the memory display mode from % to kilobytes and vice versa
l: changes process listing mode (brief/ full)
o: enters filter mode
i: ignore idle processes
n: sort processes by numerical values
How to Monitor Active Processes in Linux Using the "htop" Command
The htop is an enhanced version of the top command in Linux, providing a user-friendly interface with advanced features for process management, historical resource usage data, and interactive process control. Notably, htop allows for both vertical and horizontal viewing of the process list, offering a more comprehensive perspective compared to its predecessor, `top`.
To use the htop command, you must install it by typing the command below.
sudo apt-get install htop
After the installation, you can type htop in your terminal to execute the instruction.
Executing this command opens a full-screen display presenting the current status of processes, including essential resource metrics such as CPU usage percentage, memory usage, and execution time.
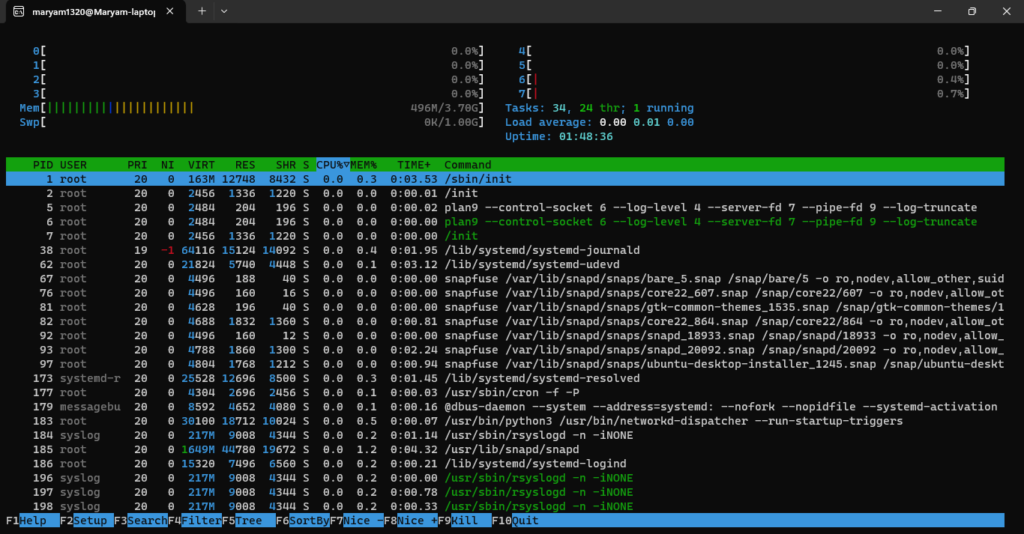
You’ll be presented with a list of process commands. For your processes, you can apply actions such as search (F3), filter (F4), kill (F9), and sortby (F6).
The table below outlines the distinctions between top and htop
Feature
top
htop
Interface
Interactive and full-screen
Text-based and terminal-based
Process information
Detailed
Less detailed
Process management
Advanced options
Limited options
User experience
More user-friendly
Less user-friendly
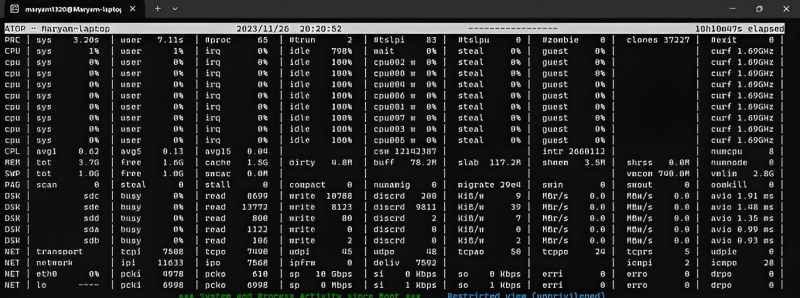
Guide on Monitoring Linux Processes with the "atop" Command
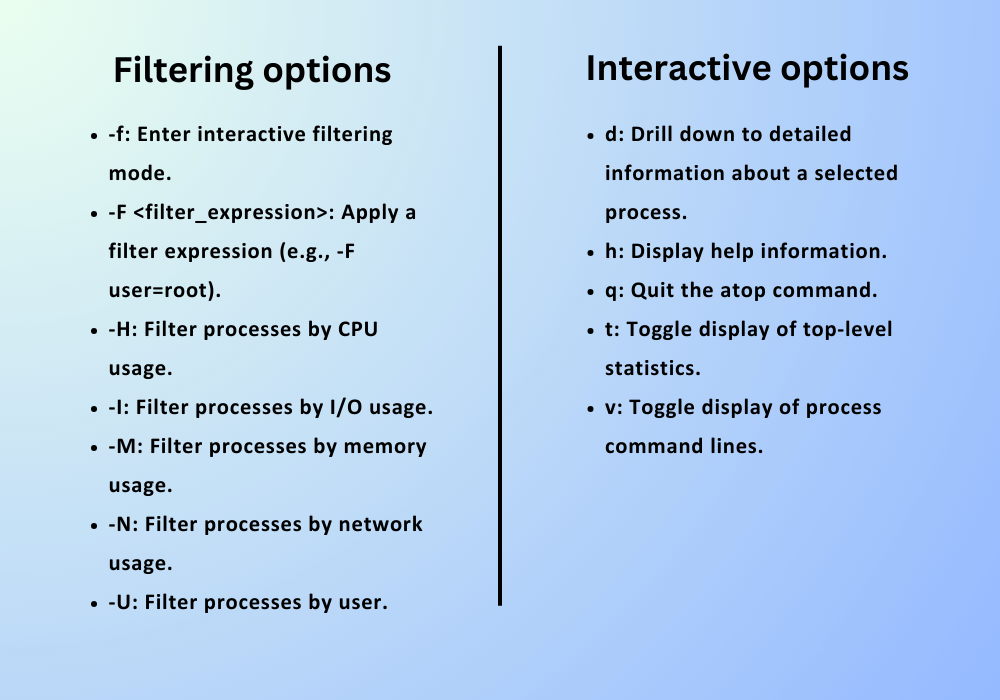
The utility of the atop command lies in its advanced monitoring capabilities, encompassing CPU usage, memory usage, and I/O metrics. Beyond basic monitoring, it provides interactive features such as filtering and sorting of processes, offering users a more nuanced and flexible approach to analyzing system performance.
Install atop by typing the given command, and once installed, simply run atop in your terminal to utilize its monitoring capabilities.
sudo apt install atop
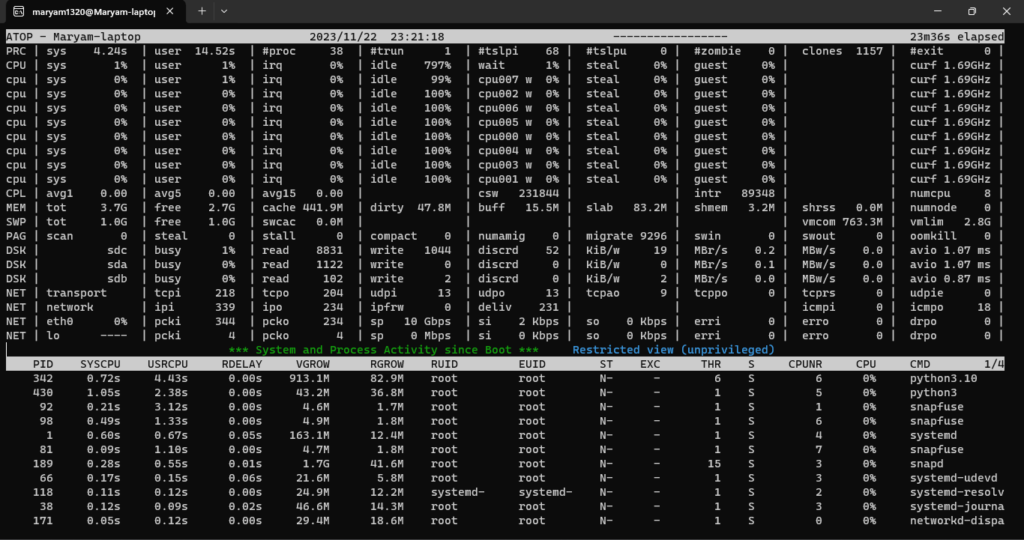
When executed, this command will launch an interface displaying comprehensive information on the system resource utilization for all active processes. Offering real-time insights into current resource usage and historical data spanning up to 28 days, it provides detailed metrics on each process, including CPU usage, I/O statistics, and thread utilization.
About
Each specific process is composed of multiple threads, allowing threads from different user processes to run concurrently. Thread information can be viewed using commands such as ps -lf or htop -T.
Additionally, processes exhibit parent-child relationships within the process hierarchy. This hierarchical structure involves parent processes and their corresponding child processes, and it can be examined using commands like ps -l or htop -T.
Frequently Asked Questions
Your statement is accurate. Using options like `-u`, `-H`, `-M`, and `-F` with the `ps` command in Linux allows system administrators to filter processes based on specific criteria. The example you provided, `ps -F user=root`, specifically filters processes associated with the root user. This kind of selective filtering is essential for system administrators to manage and optimize system performance based on their requirements.
Utilizing options such as -r, -F, -c in commands like ps -F ‘%CPU’ -r sorts processes based on CPU usage in descending order.
Identify the process consuming the most CPU by utilizing the top command with the -H option.