Step by step to Check CPU Usage in Linux

For Linux system administrators or users, effectively monitoring system resources, particularly CPU usage, is crucial. This data aids in identifying performance bottlenecks, optimizing the operating system, and determining when hardware upgrades are necessary.
17 Command Line Tools to Monitor CPU Usage in Linux
In this article, we’ll introduce 17 command-line tools that you can utilize to check CPU usage in Linux, along with addressing any other relevant questions in a convenient FAQ section. To utilize these commands, simply open the terminal, enter them, and execute. It’s that straightforward.
Jump To...
1. top
This tool is among the most commonly used for monitoring CPU usage in Linux. It furnishes real-time data on system resource usage, encompassing the CPU. The output displays a roster of processes active on the system, arranged by average CPU usage.
2. htop
A user-friendly alternative to the top command is htop. It offers an interactive, real-time perspective of system processes, encompassing CPU usage, memory usage, and system processes. Users can sort and filter processes, transmit signals to processes, and monitor performance through color-coded visualizations. Its customizable interface and simplicity of use render it a favored alternative to the standard top command.
3. mpstat
This tool furnishes comprehensive insights into CPU usage, encompassing the percentage of CPU time allocated to various modes, such as user mode, system mode, idle time, idle processes, and input/output (I/O) wait. It excels in delivering information on CPU usage across multiple cores and processors.
4. ps
This tool offers insights into the system’s present processes, inclusive of CPU usage. Its output aids in identifying processes that utilize significant CPU resources, as well as memory usage and Process IDs (PIDs), among other details.
5. uptime
Employ the uptime command to gather details regarding the system’s uptime and the average system load over the preceding 1, 5, and 15 minutes. This command facilitates monitoring system uptime and recognizing instances of elevated system load. uptime serves as a straightforward yet invaluable tool for system monitoring.
6. vmstat
This command furnishes insights into system resource utilization, encompassing CPU usage. It aids in identifying potential performance bottlenecks and diagnosing issues associated with memory usage. Additionally, vmstat facilitates the observation of swap space and page I/O.
7. sar
The Linux command you’re referring to is likely sar. This versatile performance monitoring tool offers historical performance data on various system processes, providing insights into various system resources, including CPU usage.
8. iostat
The command you’re describing is iostat. It’s a useful tool for monitoring system input/output (I/O) performance, providing information on disk usage, I/O operations per second, data transfer rates, and more. It’s particularly helpful for diagnosing disk I/O issues, optimizing system resource allocation, and even displaying CPU usage alongside I/O statistics.

9. pidstat
The command you’re referring to is pidstat. It’s a versatile tool that provides detailed information on resource usage for specific processes in Linux. Like other monitoring commands, pidstat can monitor CPU usage, memory usage, and disk I/O for individual processes. This makes it incredibly useful for identifying processes that may be consuming too many system resources and optimizing system performance. It offers insights into specific processes, including their CPU usage, user processes, and more, making it an essential tool for system administrators and users alike.
10. dstat
The dstat command is indeed a powerful tool for monitoring system performance in real-time. It provides a comprehensive view of your system and running processes, allowing you to diagnose performance issues and optimize resource allocation effectively. With dstat, you can easily display CPU usage, user processes, idle processes, and various other CPU statistics, giving you valuable insights into your system’s performance and helping you make informed decisions about resource management.
11. atop
The atop command is an excellent tool for detailed system monitoring and analysis. It offers insights into various system resources, such as CPU, memory, disk I/O, and network file system utilization. With atop, you can monitor real-time performance metrics and even record system activity for later review and analysis. This versatility makes it invaluable for diagnosing performance issues, optimizing resource allocation, and keeping track of running processes to ensure system stability and efficiency.
12. nmon
Nmon, also known as Nigel’s performance Monitor, is a versatile tool used to monitor a wide range of system resources, including CPU, memory, disk I/O, and network utilization. It provides a detailed view of computer performance and is valuable for diagnosing performance issues, optimizing resource allocation, and managing user processes. Nmon is particularly popular among system administrators for monitoring and managing computers running the Linux kernel.
13. glogg
The glogg command is employed for examining and parsing log files. It offers a graphical interface that facilitates rapid and efficient searching within log files. glogg enables users to identify critical log entries and exclude irrelevant data, making it indispensable for diagnosing computer problems.
14. iftop
The iftop command is a real-time network traffic monitoring tool that displays current network connections and their associated bandwidth usage. It is useful for identifying processes that are generating high network traffic and for troubleshooting network performance issues. With iftop, administrators can gain insights into network utilization and optimize network resources effectively.
15. sysstat
The sysstat command in Linux is a comprehensive performance monitoring tool that offers a collection of utilities such as sar, mpstat, and iostat. These utilities provide detailed information about system resource utilization, including CPU, memory, and disk usage. By using sysstat, administrators can gain insights into Linux processes, diagnose performance issues, and optimize system resource allocation effectively.
16. cpulimit
The cpulimit command in Linux is a kernel-level tool used to restrict a process’s CPU usage, thereby reducing CPU load and utilization. By limiting the CPU usage of processes, cpulimit helps prevent excessive consumption of CPU time, which can lead to system performance issues. This tool is simple yet effective in managing resource utilization and ensuring the responsiveness of the system.
17. cgroups
This Linux command, abbreviated as “cgroups,” stands for control groups. It is utilized to manage the allocation of system resources to groups of processes, including CPU, memory, and disk I/O. cgroups empower system administrators to define limits and priorities for resource usage, ensuring that critical processes receive adequate resources.
These are merely a selection of command-line tools accessible for monitoring and assessing CPU usage in Linux. As anticipated, each tool possesses unique advantages and drawbacks, necessitating the selection of the most suitable one for your requirements. Whether troubleshooting performance issues, optimizing system efficiency, or monitoring resource utilization, these commands offer the necessary insights to make informed decisions.
We have explored a range of commands for monitoring CPU performance on Linux and reducing CPU load. It is advisable to thoroughly comprehend each command before utilization. Additionally, it’s crucial to acknowledge that employing these tools may consume CPU resources, with varying degrees of impact. Therefore, consider the CPU usage implications when employing any of these tools.
Ultimately, leveraging these commands enables the identification of processes consuming excessive CPU time, evaluation of available memory, and identification of any processes experiencing stalls due to network or disk access wait times.
How can I monitor the top 10 CPU-consuming processes in Linux?

To monitor the top 10 CPU-consuming processes on Linux, you can utilize the top command in the terminal. It offers a real-time display of the system’s active processes, detailing their CPU and memory usage.
To access it, open a terminal window and input top. This will present a list of running processes, ordered by their CPU consumption. The process with the highest CPU usage will be listed first. Additionally, you can press the Shift + m keys to sort the processes by memory usage instead of CPU usage.
Alternatively, you can employ the ps command to obtain a snapshot of processes and their CPU utilization. For instance, the following command will display the top 10 processes ranked by CPU usage:
ps -eo pcpu,pid,user,args | sort -k 1 -r | head -10
Additionally, the htop command offers a more user-friendly interface for monitoring processes and system resource usage on Linux. It provides a real-time view of processes, including CPU usage, CPU performance, memory usage, and other relevant information.
By utilizing these tools, users can gain insights into which processes are consuming the most resources on their Linux system and take appropriate action as needed.
How can I monitor the percentage of CPU usage in Linux?
If you want to check the CPU usage percentage in Linux, it’s not difficult at all. On the contrary, there are several commands that you can use. Here are some of the most popular ones:
top Command: This real-time process monitoring tool provides a detailed view of the system’s resource usage. To launch it, open a terminal and type “top“. The first line of the output shows the total CPU usage percentage, along with the utilization of individual CPU cores.
mpstat Command: The mpstat command is part of the sysstat package and provides a detailed view of CPU utilization, including the percentage of CPU time spent in user mode, system mode, idle, and I/O wait. To use the mpstat command, you can type “mpstat” in the terminal and hit enter.
iostat Command: The iostat command is part of the sysstat package and provides information on CPU utilization, disk I/O, and network I/O. To see the CPU utilization, type “iostat” in the terminal and hit enter. The output will show the average CPU utilization over a specified interval.
htop Command: This is a more user-friendly alternative to the top command, providing a real-time view of the processes and their resource usage. To use it, simply type “htop” in the terminal and hit enter. The CPU usage percentage will be displayed at the top of your screen.
vmstat Command: The vmstat command provides information on system resources and process-related statistics, including CPU utilization. To use the vmstat command, type “vmstat” in the terminal and hit enter. The output will show the CPU utilization in system mode, user mode, and idle time.
Using any of these commands, you can quickly check the CPU usage percentage on your Linux system and CPU load. This helps you determine whether your system is running efficiently or if any processes are consuming excessive resources.
How Do I View Average CPU Usage in Linux?
You can utilize various command line tools to observe CPU usage on Linux. Here are a few of the most frequently employed ones:
- top Command: This command offers a real-time display of the system’s resource usage, encompassing CPU utilization. To invoke it, open a terminal and enter top. The initial line of the output showcases the overall CPU usage, alongside individual CPU core usage.
- htop Command: htop is a more user-friendly alternative to the top command, furnishing a real-time perspective of processor usage. To employ the htop command, input htop in the terminal and press Enter. The CPU usage is exhibited at the screen’s summit.
- mpstat Command: A component of the sysstat package, the mpstat command furnishes comprehensive data on CPU utilization, encompassing the percentage of CPU time allocated to user mode, system mode, waiting time, and I/O wait. Once more, to utilize the mpstat command, type mpstat in the terminal and hit Enter. That’s all there is to it.
When you use any of these commands, you can quickly see the CPU usage on your computer (or virtual machine). This enables you to determine whether your system is running efficiently or if any processes are consuming excessive resources. In other words, using them allows you to track processor usage and better understand poor system performance, helping you identify how to fix it.
What Is the Simplest Linux Command?
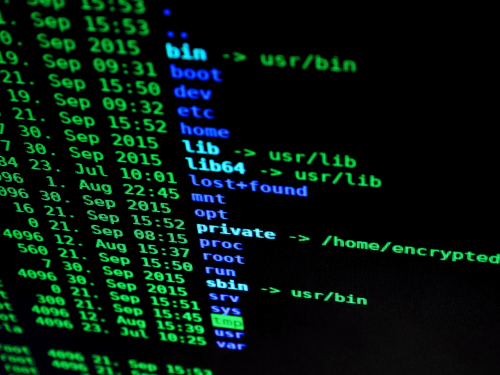
One of the fundamental Linux commands is “ls,” short for “list.” The ls command allows users to view the contents of a directory. It shows the names, sizes, and permissions of files and directories within the specified location. Mastering the ls command is crucial for navigating the file system and locating specific files or directories.
As you begin your journey with the Linux command line, it’s beneficial to familiarize yourself with essential commands such as ls, cd (change directory), and pwd (print working directory). These commands lay the foundation for basic navigation and file management tasks that you’ll frequently encounter while working with Linux systems.
Simple But Essential
Absolutely, the ls command is indeed a fundamental tool in Linux, and mastering it is a great starting point for beginners. As you become more comfortable with basic commands like ls, you’ll gain confidence in navigating the command line environment. This foundation will then allow you to explore more advanced commands and tools, enabling you to efficiently manage and utilize your Linux system to its fullest potential.
How to Determine Which Processes Are Consuming the Most CPU Resources in Linux?

Identifying the process or application monopolizing CPU resources in Linux can be daunting, especially for less experienced users. However, there are several effective methods and tools available to pinpoint the culprit. Let’s explore some commonly used approaches.
The top, htop, mpstat, and atop commands are invaluable real-time system monitoring tools for assessing system resource usage, including CPU utilization and performance. Simply running any of these commands in the terminal provides insight into CPU usage by processes, allowing you to take necessary steps to address any issues.
Indeed, there are additional commands available to monitor CPU usage in Linux:
sar Command: This tool, included in the sysstat package, offers insights into system resource utilization over time. With sar, you can track CPU usage trends and patterns, aiding in the identification of processes monopolizing CPU resources.
pidstat Command: Part of the sysstat package, pidstat provides process-level resource usage details, including CPU utilization. It allows you to monitor the CPU usage of specific processes, facilitating the identification of CPU-intensive tasks.
atop Command: atop is a comprehensive system and process monitoring utility that provides detailed CPU usage information. It enables users to monitor CPU utilization over time and identify processes consuming excessive CPU resources.
Upon identifying the process consuming the most CPU, you can take appropriate action to address the issue. This may involve terminating the process, optimizing the application code, or adjusting system settings.
Difficult Yet Essential
In conclusion, determining which process or application is hogging the CPU in Linux can be a daunting task. However, as demonstrated earlier, there are multiple commands available to help pinpoint the offender.
What command can be used to examine CPU usage in Linux?

Even though this inquiry has been addressed, it remains somewhat challenging. Therefore, let’s revisit it:
Monitoring CPU utilization and performance in Linux is straightforward, thanks to commonly used commands that provide this information. Here are some of the most frequently used commands for checking CPU usage in Linux:
- top Command: The top command is widely used for real-time monitoring of CPU usage, performance, and system resource utilization. It offers a detailed view of processes and their resource consumption. To launch it, open a terminal and type “top“.
- htop Command: htop is considered more user-friendly than top and provides real-time insights into processes and resource usage, including CPU data. Simply type “htop” in the terminal to use it.
- mpstat Command: Part of the sysstat package, mpstat offers detailed CPU utilization information, including user mode, system mode, idle time, I/O wait, and overall CPU usage percentages. To use it, type “mpstat” in the terminal.
- ps Command: The ps command provides details on current system processes, including CPU utilization. To view CPU usage for all processes, type “ps aux” in the terminal.
This is it! Employ the aforementioned commands to assess your system’s CPU usage and performance – ideal for performance evaluations.
Frequently Asked Questions
CPU utilization in Linux refers to the proportion of CPU time the system and its processes consume at any given moment. Essentially, it quantifies the degree to which the CPU’s processing capacity is utilized.
CPU utilization can be represented as a percentage of total CPU time, indicating the ratio of CPU time in use compared to the time the CPU remains idle.
Your system is experiencing a high level of load.
A high CPU utilization in Linux can indicate that the system is under heavy load, which can be caused by various factors such as resource-intensive applications, numerous active processes, or insufficient system memory. On the other hand, low CPU utilization may suggest that the system is not fully utilized and could benefit from additional processing tasks.
Monitoring CPU utilization and system processes in Linux is crucial for ensuring efficient system operation and identifying any performance bottlenecks. Commands like top, htop, and mpstat allow you to quickly check CPU utilization on your system and determine whether processes are consuming excessive resources, prompting action if necessary.
A Linux command is a tool or application that operates within the command-line interface.
A command-line interface is a platform that interprets lines of text as commands for your system. Graphical user interfaces (GUIs), on the other hand, are graphical representations of command-line programs designed to simplify computer usage and software installation and usage.

